ABOUT OUR EXPERIMENT
Our Question: Can differing values in the pH of the water affect the growth rates of the plants and/or fish in an aquaponics system?
Hypothesis: If free energy levels are directly proportional to pH values, then the higher free energy level associated with a lower pH value should result in more growth in the plants and/or fish in an aquaponics system.
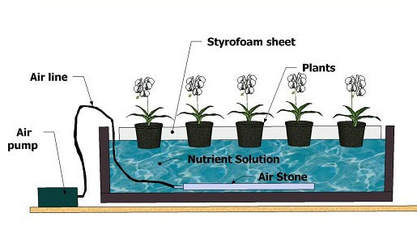
Methodology: The set-up will be the same for the control and experimental groups. We will have two 10 gallon tanks, which will be filled with 10 gallons of water, to place our fish and plants. In each tank we will have 3 comet goldfish. Each tank will have an air pump connected to an airline and air stone in order to maintain healthy oxygen levels for the fish. The tank will have a Styrofoam sheet to hold the pots so that the plants will float atop the surface of the water in each tank. We will grow basil, with 4 pots in each tank. We will place 3 seeds in each pot to make it more likely that at least one plant will germinate. In order to make sure that the pH in each tank remains constant, we will have a supply of pH conditioner and pH readers.
Independent Variable: The pH levels in the water
Dependent Variable: The growth rate of the fish (goldfish) and the plants (basil)
Control Variables: The amount of sunlight, fish feed, plants, and goldfish
Data Collection Process: We will measure the rate of growth of the plants and fish present in each tank.
To measure the growth of the fish we will use their change in mass in grams (g). To measure their mass we will: 1) Place a bucket full of water on the scale and measure its mass 2) Once recorded, we will place the fish in the bucket and record the new mass value 3) We’ll then subtract the mass of the water from the mass of both water and fish and record the fish’s mass 4) We’ll then remove that fish and 5) Repeat steps 1-4 until the mass of each fish has been measured.
To measure the growth rate of plants we will measure their height in centimeters (cm.) To do this every week we will: 1) Place a ruler next to the stalk of the plant with one end of the ruler touching the soil 2) Align the stalk with the edge of the ruler with the cm side 3) Measure the plant’s stalk from the bottom of the soil to the tip of the stalk 4) Record the height and 5) Repeat steps 1-4 until each plant has been measured.
Analysis of Data: We are going to compare the growth rates of fish and plants in the baseline group/control group where we don't alter anything in the aquaponics system to the growth rates in the independent group where the pH level of the water has been changed. We will collect all our data in several charts, one for each aquaponics system, with plant growth and fish growth for each month, and at the end of the experiment we will put our data into graphs. We will compare each month's data of the plants and fish's growth, and we will calculate the change in the independent group, if there is any. We will also state what we could have done differently to the experiment to make it better to observe and execution.
Hypothesis: If free energy levels are directly proportional to pH values, then the higher free energy level associated with a lower pH value should result in more growth in the plants and/or fish in an aquaponics system.
Methodology: The set-up will be the same for the control and experimental groups. We will have two 10 gallon tanks, which will be filled with 10 gallons of water, to place our fish and plants. In each tank we will have 3 comet goldfish. Each tank will have an air pump connected to an airline and air stone in order to maintain healthy oxygen levels for the fish. The tank will have a Styrofoam sheet to hold the pots so that the plants will float atop the surface of the water in each tank. We will grow basil, with 4 pots in each tank. We will place 3 seeds in each pot to make it more likely that at least one plant will germinate. In order to make sure that the pH in each tank remains constant, we will have a supply of pH conditioner and pH readers.
Independent Variable: The pH levels in the water
Dependent Variable: The growth rate of the fish (goldfish) and the plants (basil)
Control Variables: The amount of sunlight, fish feed, plants, and goldfish
Data Collection Process: We will measure the rate of growth of the plants and fish present in each tank.
To measure the growth of the fish we will use their change in mass in grams (g). To measure their mass we will: 1) Place a bucket full of water on the scale and measure its mass 2) Once recorded, we will place the fish in the bucket and record the new mass value 3) We’ll then subtract the mass of the water from the mass of both water and fish and record the fish’s mass 4) We’ll then remove that fish and 5) Repeat steps 1-4 until the mass of each fish has been measured.
To measure the growth rate of plants we will measure their height in centimeters (cm.) To do this every week we will: 1) Place a ruler next to the stalk of the plant with one end of the ruler touching the soil 2) Align the stalk with the edge of the ruler with the cm side 3) Measure the plant’s stalk from the bottom of the soil to the tip of the stalk 4) Record the height and 5) Repeat steps 1-4 until each plant has been measured.
Analysis of Data: We are going to compare the growth rates of fish and plants in the baseline group/control group where we don't alter anything in the aquaponics system to the growth rates in the independent group where the pH level of the water has been changed. We will collect all our data in several charts, one for each aquaponics system, with plant growth and fish growth for each month, and at the end of the experiment we will put our data into graphs. We will compare each month's data of the plants and fish's growth, and we will calculate the change in the independent group, if there is any. We will also state what we could have done differently to the experiment to make it better to observe and execution.
